


The annual flu barrage has already started in our local paper Franklin County news with this little pearl:
Before you read anything else, please flick through this presentation put together by the Cochrane Collaboration Influenza group (Yes, the last three slides bunk out, but the rest is good! This Cochrane powerpoint puts similar things in a different way... ), who believe that you need to understand what the issues are all about, before you can interpret what the “words” that the medical profession spout, REALLY mean.
Now that you’ve done that, you will understand some of the amusing things about the Franklin County News propaganda. Obviously, an “influenza-like illness” which the Collaboration describes, isn’t necessarily the flu and can’t be “prevented” by any means. However, Dr Sue Huang (the head of the National Influenza Centre) always counts all those “influenza-like illnesses that can’t be prevented, as the flu, and tells the public they can be prevented. The reason she does that, is that if you REALLY KNEW how few “influenza-like illnesses” WERE actually the flu, then you would start asking questions like, “Why are they deliberately inflating the data?” Simple. They do that to make you think that flu is a really big deal.
What you won’t know about the article above though, is that:
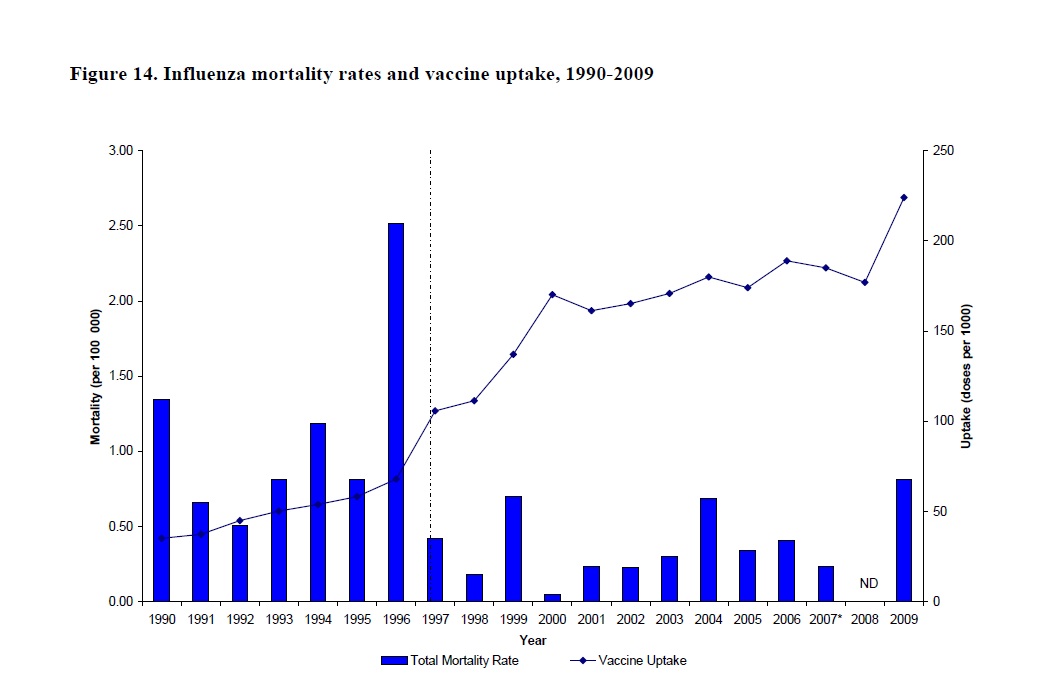
1) The hospitalisation data is wrong. Look very closely at this graph and THINK about what you are seeing here:
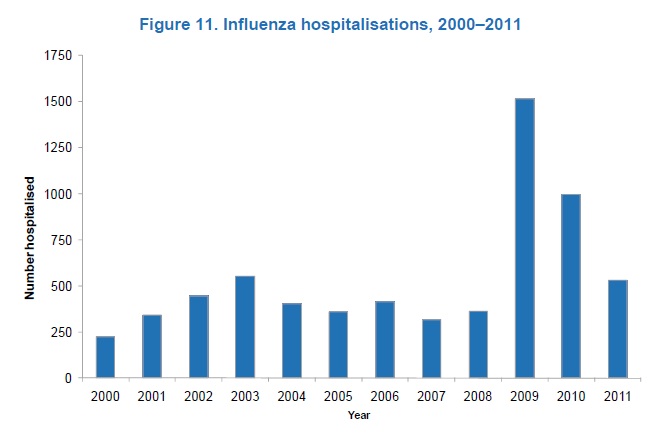
2) Of the 1,517 hospitalisation, 1122 were for Swine Flu. And how many of those hospitalizations would have occurred without the terrorism everyone endured via the media, that the upcoming pandemic could wipe out billions?? In the 2009 Annual Influenza Report there were 35 deaths recorded for swine flu,
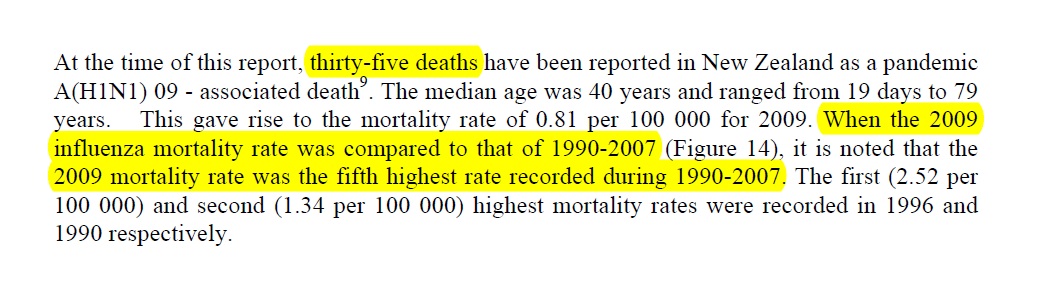
but by 2011, that total was 49 deaths. … So if there were only 49 flu deaths in 2009, you’ve got to start asking a few questions, like….
3) In the 395 influenza hospitalizations for “something else” - the presumably more "vicious" influenza types - how many deaths were there? Apparently, none. Something the Health Department never talks about is, “How many people hospitalized were VACCINATED?" Why? When the medical profession tells the truth, the result isn't pretty, so they are best to not go there, huh? (PDF in case it disappears!).
4) How many REAL deaths were really CAUSED by the flu? 35 or 49? And how many deaths were vaccinated?
There’s always been silence with regard to those statistics. And what are the vaccinated patients told? “You will have got a flu that isn’t one in the vaccine!” and the patients never think to ask, “Did you take a swab to find out WHETHER my flu was supposed to be covered with the vaccine?” There is an old saying that statistics can be lies, damned lies and statistics. Silence can be either golden… or.. yellow.
How many people even got “the flu”? What Dr Jefferson described in his presentation applies here as well.
Let me show you: the Health Department considers that the number of people who get the flu in this country, is the number of people who stumble into the doctor after convincing themselves that they’ve got all the symptoms they have just heard some medical zombie describe on the radio.
On page 25 of the 2011 Annual Report from the Public Surveillance website we read:
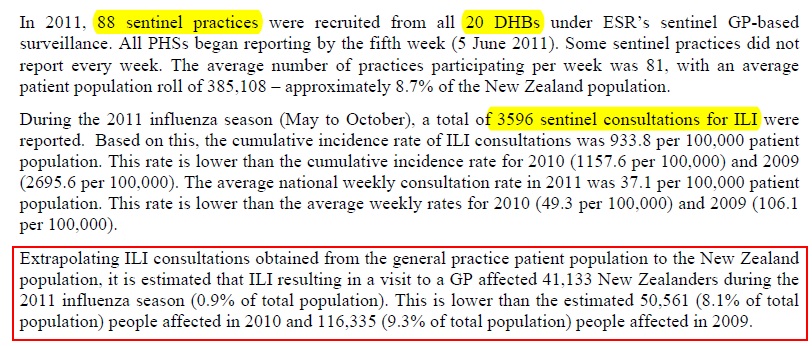
But consider this… each of these 88 practices take ONLY three swabs a week, Monday, Tuesday and Wednesday. The lucky first person who clutches their head on each of those days, and says, “Doc, I’ve got the floooooooo” is told to, “Open wide” and a nasopharangeal swab is taken. Just three a week (can’t overload the testing system) … and that tiny number of swabs are sent off for testing, and those results can look like this - with the DARK blue being the numbers of swabs, and the LIGHT blue being actual FLU:
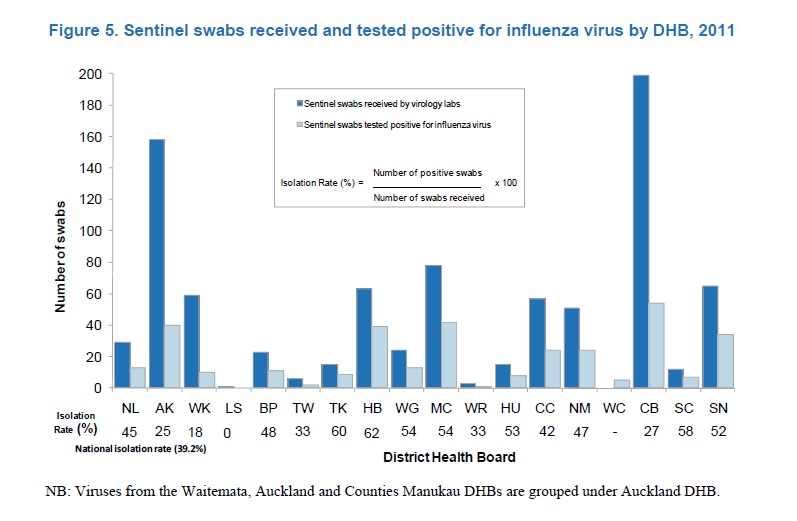
The cases are estimated by taking the number of consultations for influenza-like illnesses reported weekly to the ESR by the 88 sentinal practices, averaging that out and multiplying those numbers, with the number of practices in the country.The swabs from sentinel practices, labs and hospitals, lets ESR know which percentages are positive, and then they test them to find which flu types predominate. However, we rarely hear whether or not the flu types match the vaccine, and we never hear whether the influenza-like illnesses (flu or non-flu) were vaccinated. So on the basis of a few hundred swabs from the estimated 41,133 New Zealanders the crystal ball says had “influenza like illnesses” ….. as you can see, a lot of the cases that walk in, aren’t the flu at all.
Not that the patients with negative swabs will be told they don’t have the flu. Instead they walked out the door clutching some of the millions of dollars of Tamiflu the Government brought in because of the “deadly” pandemic.
To the Health Department … all the tests that are negative for the flu are counted as the flu anyway. Why? On page 62 of the 2011 Annual Flu report, apparently doctors don’t know how to take swabs properly.
In the next few weeks, the media will parade “400 deaths caused by Influenza – nearly the same as the annual road toll rate!”
Where does this “400 deaths” a year come from?After all, a 2010 report from the Influenza group to the minister says this:
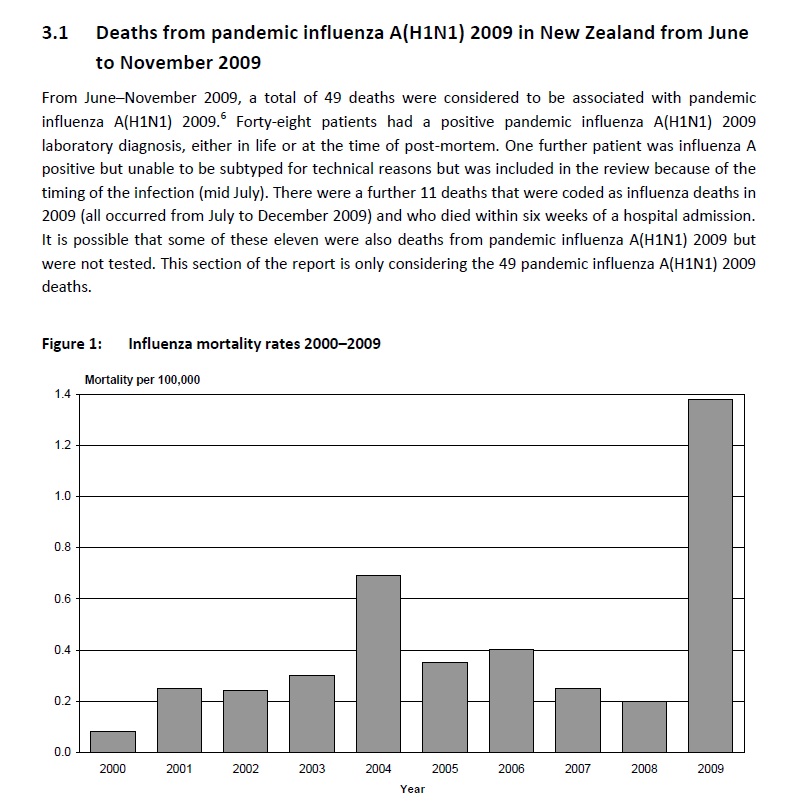
See that? 35 + some uncoded deaths = 49 deaths, the highest number of deaths since 2000. You would think that that Figure 1 graph, actually represents REAL deaths, yet we are "TOLD" that in New Zealand "approximately 400 people" will die of influenza every year.
No other disease has this magic multiplication for deaths.
With whooping cough, we are specifically told, "one" or however many.
We are not told that actually there were ten whooping cough deaths because they "estimate" there were nine others which doctors somehow .... "missed".
Apparently, with whooping cough, they "know" but with influenza, they don't.
Toddlers run over in the drive?.... we know a specific yearly total. Meningitis? .... we know a specific yearly death total. Measles? we know a specific yearly death total. With these infections, doctors have eyes.
ESR has a "specific" yearly influenza totals --- as you see above and below.
BUT for public consumption ... with FLU, the numbers in the graphs you see below - unlike all the other diseases.... suddenly aren't big enough.Why are deaths only inflated for influenza?
What you have to understand, is that that 400 deaths was jury-rigged in 1996 just before the vaccine was made free for the over 65s. The Key Opinion People in the Influenza Group, needed a nice catchy, dramatic figure to scare the living daylights out of the elderly - because at the time they said that most of these deaths were ONLY in the elderly. How they arrived at that total is is not exactly…explained on page 14 in this document.
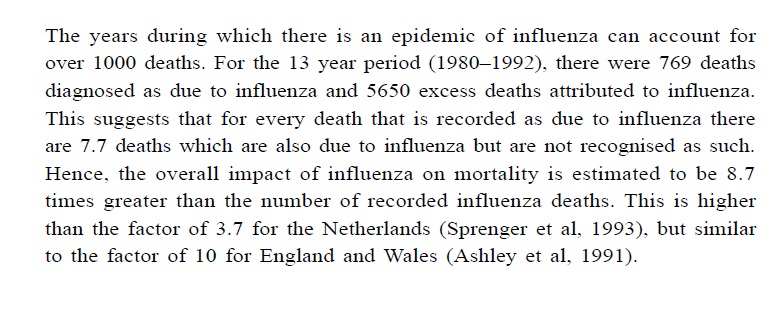
So Netherlands inflate theirs by 3.7, and the UK, by about the same as New Zealand. What's different about people in the Netherlands, that their doctors miss three quarters of the deaths and others nine-tenths? You actually get the feeling that they stick a pin on their "real" numbers, then pluck the multiplication factor out of thin air.
Why did they jury-rig the data? Because USA did. For years immemorial, the CDC used to come out with the unproveable mantra that influenza caused 36,000 deaths a year. Only recently did it occur to them that the public wasn't buying junk maths any more, so the CDC downgraded the 36,000 yearly deaths nonsense to:
"Over a period of 30 years, between 1976 and 2006, estimates of flu-associated deaths in the United States range from a low of about 3,000 to a high of about 49,000 people."
So pick your plum, people. Even the CDC is incapable of being specific about the flu as well.
If you go to the ESR Influenza page and download every annual report there (and every other report on influenza) you will NOT find the proven figure of 400 annual deaths anywhere….
Yet the IMAC-run parent site for flu says very clearly:
“Approximately 400 deaths each year in New Zealand are related to influenza infection.”
Now notice carefully, the words “RELATED to”. IMAC doesn’t say “caused by”. “Related to” is their get out of jail card, because they KNOW that every year, the ESR DOES have specific statistics..., even though everyone reading “related to” will understand those words to mean “caused by”. But apparently, it's very important to count in all these invisible "deaths" that doctors just plain miss - every year.
And if you look carefully at figure 1 way above, you can see that ESR's 2009 total of 1.4 deaths per 100,000 population does not multiply up to 400 deaths over the total population of 4.4 million people. The deaths for 2009 are one–eighth of what was "predicted" in 1996, and seventeen years later in 2011, 400 deaths are STILL being "predicted" as your routine, every year, average death toll.
Some vaccine huh? However, a 2007 ESR briefing document maintained their recorded death rate had dropped 70% since 1996! So why hasn't the imaginary one dropped as well?
Why are the influenza-"related" deaths specific to ESR but inflated to the public? See that 1996 skyscraper above? As confirmed in the 2003 Annual report on page 10 we read:
![]()
The "highest peak" was 94 deaths. ONLY. Yet .... 1996… was the year that they inflated and pulled from the plum pie they baked, this mythical 400 figure, which has been used FOR THE PUBLIC ever since.
Do they do this for Salmonella? No. Cryptosporidium? No. Leptospirosis? No. What other diseases do they do this for? Well, sometimes they inflate the number of CASES of measles, when it suits them, but the death rates remain as ESR records them. And now they are inflating the numbers of whooping cough as well, but the death rates will remain as ESR records them.
ONLY influenza death rates are inflated, yet no-one asks, "Why are the public told lies about the flu deaths?"
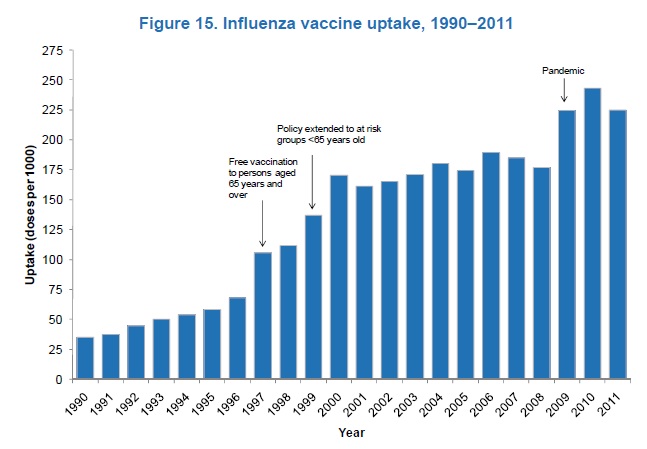
So if 94 was the highest number of deaths in 1996, followed by 49 in 2009, where are your 400 annual deaths in this 2009 updated graph on page 27 of the 2009 Annual report:
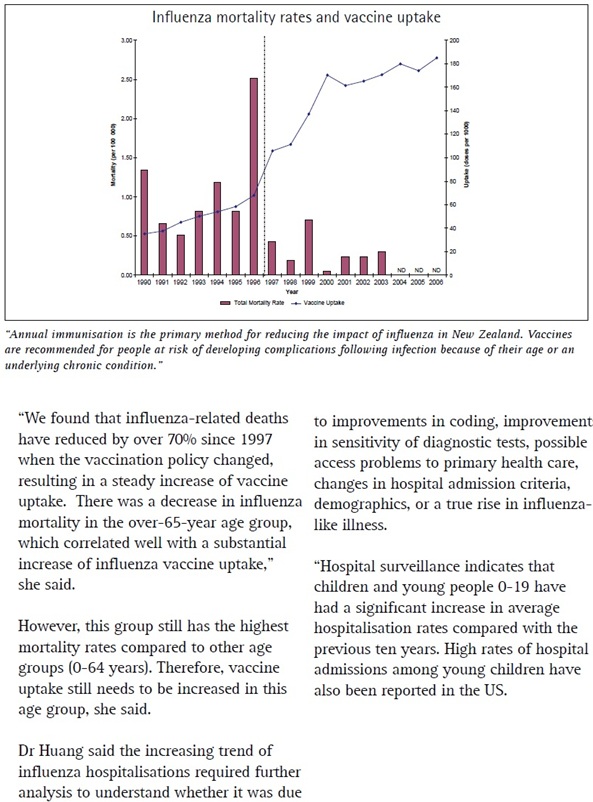
Should we continue to be hit over the head with the 1996-manufactured 400 deaths a year figure? And on page 45 of the 2011 annual report this graph appears:
So ESR are saying that REAL deaths went down 70% between 1996 and 2007 as a result of a 25% use of the flu vaccine, yet IMAC et all are saying that the annual death toll is still around 400 - which is the same death rate as before the vaccine was even used?!
New Zealand doesn’t even give the media specific data on influenza deaths except when forced to, in pandemics – which makes you wonder if they hoped for the maximum number of deaths in 2009, so as to finally have something to talk about.
Here is the closest I’ve come to the actual formula by which one reported "influenza-like illness" suddenly becomes 72 estimated cases ...from an Otago flu presentation done in 2003:
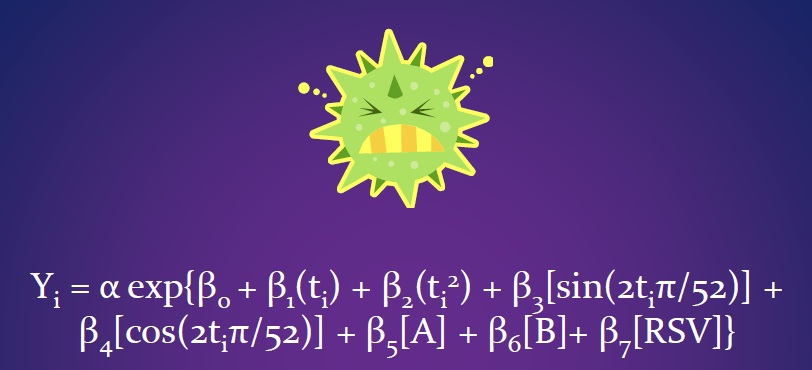
Are you now any the wiser?
This is what you have to use when you don’t want to show the public the ESR's real tiny totals.
Why is it, do you think, that they feel the need to inflate the data?
Do they think that conning the public into thinking that influenza is some mythical monster doctors have trouble defining, can't swab for, and certainly can't see well enough to define death properly.... will "add value" to the vaccine? Surely any sensible thinking patient would realise that such incompetence actually means the doctors have just lost all their brownie points when it comes to the flu?
They kept real data for the pandemic flu in 2009, but did YOU hear about that in the media? Perhaps they avoid talking about that because we and they were lead to believe that the Swine flu was going to be a banger, when it turned into an embarrassing fizzle.
You could just about hear the propagandists’ copious tears in the corridors of medical power, when they only had 35 deaths to show for a “pandemic”. They took another two years to squeeze another 14 deaths from the bottom of a barrel somewhere to make 2009 look a bit worse.
But here's a major point.. The H1N1 turned out to be “markedly milder” than “normal”.
Milder? So what caused so many MORE hospitalizations?
Doctors were being told, even before H1N1 arrived, that in Mexico, the swine flu was most deadly to those with GOOD immune systems, because the healthy immune system fighting the flu, baked the lungs. Even before the first case here, some media reports portrayed H1N1 like Ebola on legs. If – as we now know - all the other flu types are way more vicious than H1N1, shouldn’t there have been FAR MORE hospitalizations and deaths in all the OTHER years surrounding 2009?
Why were there SO MANY hospitalizations IN 2009? Why were there so many deaths in a mild year, when in the more vicious years, there were so few deaths? Could it be that keeping away from fear-filled doctors means you're more likely to live?
Did doctors whip themselves into self-induced fear-filled froth, believing that H1N1 was a death sentence, slamming Tamiflu at everyone, and sending not-so-sick people to hospital, treating them ultra-aggressively…. so….. they died?
If something is so bad that it could bake lungs, why would there be any DOUBT about a higher than average death data from H1N1?
Do you think that pandemic mentality surged, enthusing the Influenza groupies to think that “at last”… they record deaths might SHOW people how bad flu could be, just to ramp up more publicity for vaccines?
Did they carefully keep proper death stats in 2009, in the hope that there would be hundreds of people die? Every week we were regaled with an update on how many more had died, then all talk of deaths... just fizzled.
And then came the announcement that the 2010 “second wave” would be worse than the first. Remember that?
So what happened in the second wave? It was a much smaller fizzle, but with a remarkable twist….it was far worse for those sent to hospital.
In a 2011 Euroserve medical publication, Dr Bandaranayake explains it this way:
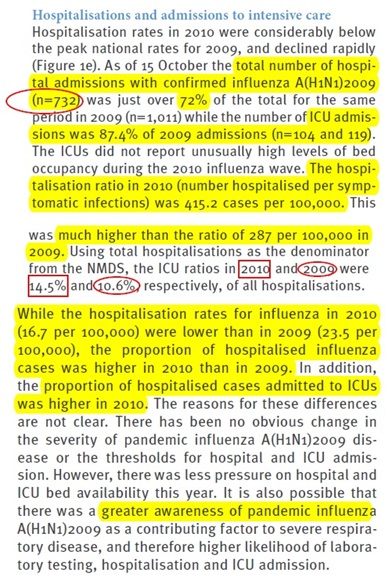
So an “explanation” for nearly double the rate of ICU use, could be that doctors and nurses had a “greater awareness” of flu as "a contributing factor to severe respiratory disease"?
Duh, Hasn't severe respiratory disease from any cause, always been clinically obvious?
Or... "they didn’t have “high bed occupancy"? So..? What..? ....were they just bored and didn't want to twiddle their thumbs? Um.. … did they think, “What if someone healthy dies…?” and USED Intensive care units MORE, just for the thrill of something to do!!!???.
Were they proving that they were needed in their jobs?
Whatever happened to the Gold Standard of “assessing a person SOLELY based on the clinical medical need”?
Did preconceived fear in the minds of the medical profession inflate what they saw, lead to more uncertainty, and define their actions .... resulting in far more hospitalization, ICU treatment and deaths than was perhaps necessary in both years?
This same vaccine efficacy and death data manipulation happened in Canada, which the head of the Cochrane Collaboration Dr Jefferson, pointed out via the Vancouver Sun on November the 19th, 2012:
So what does the Cochrane collaboration have to say about the effectiveness of the flu vaccine?
Here are the take home points from the last three Cochrane Reviews of the Flu vaccine:
Vaccines for preventing influenza in healthy adults (2010 Review)
Approximately half a working day lost and half a day of illness were saved but no effect was observed against pneumonia. Vaccination had a modest effect on time off work and had no effect on hospital admissions or complication rates.
Vaccines for preventing influenza in the elderly (2010 Review)
The available evidence is of poor quality and provides no guidance regarding the safety, efficacy or effectiveness of influenza vaccines for people aged 65 years or older.
We concluded that the general quality of influenza vaccines studies is very low and that publication in prestigious journals is associated with partial or total industry funding. We could not explain this association with study quality, size or its status (registration trials using surrogate outcomes such as antibody titres were not included in the review). As our elderly dataset formed a major part of our overview of influenza vaccines studies, it is likely that that data presented in this review are so biased as to be virtually uninterpretable.
Vaccines for preventing influenza in healthy children (2012 Review)
The review authors found that in children aged from two years, nasal spray vaccines made from weakened influenza viruses were better at preventing illness caused by the influenza virus than injected vaccines made from the killed virus. Neither type was particularly good at preventing ’flu-like illness’ caused by other types of viruses. In children under the age of two, the efficacy of inactivated vaccine was similar to placebo. It was not possible to analyse the safety of vaccines from the studies due to the lack of standardisation in the information given, but very little information was found on the safety of inactivated vaccines, the most commonly used vaccine in young children.
~~~~~~~~~~~~~~~~~~~~~~~~~~
Let's ponder on what sort of positive spin will be put on the latest CDC study which shows that the influenza vaccine in the over 64’s, is 91% INeffective in the elderly, despite the fact that in the past three years, a 4 times higher potency dose influenza vaccine has been used for American over 65’s – which .... still doesn’t work.
CIDRAP reports the study this way:
"VE in those 65 and older against both influenza A and B was 27% (95% CI, -31% to 59%), and against H3N2 it was 9% (95% CI, -84% to 55%), but both numbers are statistically not significant."
Quite how IMAC is going to make this data impress the public, and how they will interpret confidence intervals transcending zero, is a bit of a mystery. Unless they simply think it doesn't matter, because who apart from "idiots", looks at their science?
Perhaps they’ll just say nothing, and hope no-one notices.
Think about this carefully. The Americans now give their elderly a vaccine four times more potent than the old flu vaccine, and it still doesn’t work.
They use a “normal” vaccine for the adolescent to 65 age group, which is supposed to protect somewhere between 45 – 55% depending on the type of the flu, .... but that looks to be more than a long reach. Data for pregnant mothers and babies is absent.
The CDC study itself says:
“This study observed a VE point estimate against influenza B (67%) that was much higher than the 9% VE estimate against A (H3N2) among older adults, although the precision of estimates was limited by the small sample.”
But note that approx 30% of B viruses circulating were not of the type present in the vaccine... and 99.5% of the H3N2 strains were in the vaccine.
And H3N2 is a much more pathogenic virus.
So how ... could the USA vaccine possibly have been 67% effective against the B strain?
No doubt the American spin doctors will be reworking their other computer risk models to produce less embarrassing results... especially since the vaccine was the nearest to perfect match in recent history ...
"• 673 (99.4%) of the 677 H3N2 influenza viruses tested have been characterized as A/Victoria/361/2011-like, the influenza A (H3N2) component of the 2012-2013 Northern Hemisphere influenza vaccine.
• 4 (0.6%) of the 677 H3N2 viruses tested showed reduced titers with antiserum produced against A/Victoria/361/2011."
But the real kicker is this bit: "Overall, influenza vaccination reduced the risk for medical visits resulting from influenza A and B by 56%, from influenza A (H3N2) by 47%, and from influenza B by 67%. "
Which of course, is not true...
ALL of the “subjects” had 'influenza' - as in an “influenza-like illness”. They all went to the doctor and their ILI was THE statistic used, just like it is in New Zealand.
The difference between the study and control groups was that the study group tested positive to an influenza virus, and the controls didn’t.
They ALL had the same clinical symptoms, so it is totally false for the CDC to claim that the study showed a reduction in visits to the doctor for anything... after all, the ones who “didn’t” have the luxury of a positive laboratory diagnosis, still went to the doctor with the same flu symptoms, and shelled out the same money. And were probably also prescribed Tamiflu just like those with the real flu!
If the flu vaccine reduced visits to the doctor at all, we wouldn’t see graphs like this:
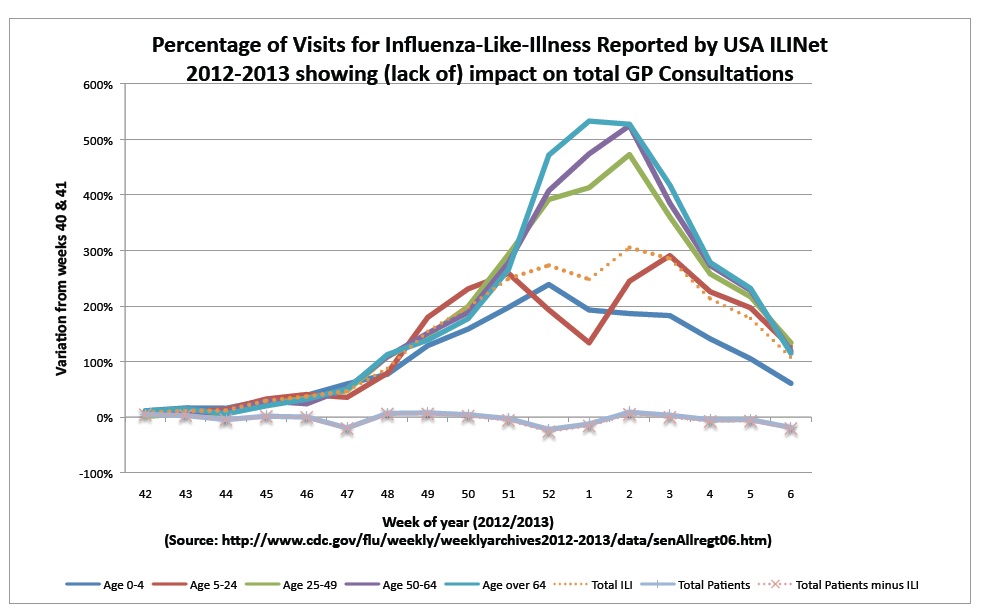
The only bit in this information that is rocket science, is understanding how the public can be duped by “estimated data” produced by ignoring negative influenza tests, and extrapolating and multiplying base data, to end up with death numbers, pulled out of thin air…. That’s a real mystery.
The rest of the data above, is perfectly understandable for people with eyes to see.
After all, if the annual New Zealand influenza death rate before 1996 was quoted by the medical profession to be 400, and is supposedly STILL "approximately" 400, ...... then something stinks, .... and it’s not the flu.